Cost Anomaly Detection for Runaway Agent Sessions
Real-time token velocity signals catch runaway loops before daily monitoring ever could.

Runaway agent sessions require session-level cost anomaly detection and hard spending limits enforced before the next API call. To stop AI coding agents from running up unexpected bills mid-session, combine real-time token-velocity signals with session, fleet, and time-period ceilings. Keep those controls in version-controlled configuration so the same review process governs both agent behavior and its financial limits.
Why agentic pipelines create a structurally different cost problem than traditional cloud workloads
Most LLM APIs are stateless, so each agent step resends the accumulated conversation history, tool outputs, and retrieved context. The next step therefore costs more in input tokens than the preceding step, even when both perform similar work. Tool-call fan-out multiplies that burden because one user request can trigger many model invocations carrying the growing payload. When a tool fails, automatic retries can append the failure message to context and make each subsequent attempt more expensive. These effects build on one another, so the added charge per task keeps growing.
ACEM formalizes these effects through the Revision Factor (RF), which captures overhead from output rejection and retries, and the Context Factor (CF), which captures rising token consumption as context accumulates. Its HITL Intensity Score (HIS) also groups oversight into four levels. The cost paradox is that token prices have fallen sharply while agent pipelines multiply unit count, so the bill climbs anyway. Unlike a new instance or storage allocation, this growth can happen without any change to provisioned resources. The cost driver is execution behavior, which makes resource-level monitoring the wrong instrument for detecting it.
Why the failure mode is not a fluke: real documented cases of runaway spend
An Analyzer/Verifier agent pair illustrates how a loop can persist without either participant recognizing failure. The agents ping-ponged for nearly two weeks, each treating its actions as legitimate progress, and produced a substantial bill. Neither had a budget ceiling. An error detector alone would not have resolved that problem because successful-looking actions were themselves the source of waste.
An AI agent tasked with scanning the DN42 hobbyist network produced a different form of repeated action. Under a blanket 'continue' directive, it repeatedly redeployed the same CloudFormation template, creating duplicate instances and load balancers. The bill reached $6,531.30, and the operator, who had no hard limit in place, appealed for donations afterward. This case shows that agent behavior can also drive infrastructure charges.
Uber's CTO announced in May 2026 that the company had exhausted its entire annual AI coding budget in four months. That enterprise-scale overrun establishes that budget exhaustion is not confined to small experiments. Defaults, continuation rules, and missing ceilings can decide how much gets spent, so reviewing configuration before a session starts is as important as runtime detection.
Why daily cost monitoring cannot detect a runaway session in time to matter
AWS and GCP cost tools default to daily-granularity monitoring, and Azure Cost Management offers it as an option. That cadence is structurally too slow for a runaway loop that can generate severe losses in hours. The failure is a mismatch between the speed of execution and the speed of detection.
Traditional cloud alerting can often anchor an anomaly to a resource-provisioning event with a timestamp. An agent's consumption can instead change after a prompt template edit, a context-window adjustment, or a model-tier rerouting. Any of these changes can happen without an infrastructure event that the monitoring system can detect. Request and token instrumentation must therefore provide the missing signal. The decisive variable is the detection window, which must shrink from hours to minutes or seconds before repeated calls compound the loss.
What token-velocity signals actually look like and why they catch loops that cost metrics miss
Token velocity is the number of tokens used per unit of time within a session. It is an early signal because a healthy coding agent spends part of its session reading files, executing tools, and waiting for I/O. Its token use is intermittent, with bursts separated by work outside the model. A looping agent can instead make LLM calls as quickly as responses return. Its consumption stays elevated.
API responses provide token counts that can be accumulated into a rolling window without waiting for a billing event. This makes velocity actionable during execution, when a control can still prevent the next call. The threshold must reflect healthy behavior for the task type. A high reading becomes more informative when it coincides with steadily growing input-token counts, repeated tool calls with near-identical arguments, or repeated retries on one tool.
Growing inputs show context accumulation, repeated arguments show a loop, and retries that keep hitting one tool show a retry storm. Measuring each session on its own keeps those patterns tied to the run that produced them. An aggregate cost total cannot preserve that behavioral distinction.
How to stop AI coding agents from running up unexpected API bills mid-session
A soft alert is not a circuit breaker because it leaves enforcement to human response time. An agent in a tight loop can keep spending while an operator reads the notification and finds the process. A circuit breaker instead monitors the signal, trips when its threshold is exceeded, and suspends execution.
That boundary must live in code. The model must still interpret an instruction to stop after a fixed spend while it works on its task. A pre-call check that refuses the next API request when the budget is exhausted cannot be overridden by the model's reasoning. Unix's ulimit provides the useful analogy, with a ceiling imposed outside the process before it consumes all available resources. Checking before dispatch also bounds overshoot to no more than a single call's worth of tokens.
Ellipsis enforces spend limits before a session continues through hard budget caps tied to each invocation, with fresh credentials minted for that session. This is the relevant platform criterion for budget cap enforcement, rather than whether a dashboard displays current spend. For graceful shutdown, the runtime suspends or halts execution at the boundary. Alerts can accompany that action, but cannot substitute for it.
How layered budget dimensions govern spend at session, fleet, and time-period levels
A session ceiling limits the maximum tokens, model calls, tool calls, retries, and dollars consumed by one run. It is necessary, but it cannot contain every aggregate failure. Even when each session is priced correctly, more runs than expected can use up the budget while each run stays within its allowance. A fleet ceiling therefore caps consumption across all sessions of a given agent type.
Time-period ceilings set limits for each developer and team during a billing period. These prevent one engineer or agent type from consuming a disproportionate share before the period closes. A retry storm can appear in tool-call count before its dollar total becomes conspicuous, while context bloat appears directly in input-token counts.
A central budget manager backed by a persistent store connects these controls. It reserves spend before each call, reconciles actual usage afterward, and blocks over-budget actions. ACEM separates total agentic cost into LLM token cost, Human-in-the-Loop cost, and infrastructure cost. That decomposition reinforces why a token cap alone is not a complete budget model, since the relative costs change with task complexity and autonomy.
Why cost anomaly detection requires full session observability, not just spend totals
Stopping an expensive session stops the loss, but it does not explain what went wrong. Without attribution to a trigger, deployment, configuration default, or agent action, the same failure can return at the next deploy. A spend total says how much was consumed. Operationally useful detection must preserve the sequence that connects cause to cost.
That sequence requires every tool call, its arguments and output, and separate input and output token counts for each model call. The trace must also identify the session trigger, active configuration version, and credential scope. A diff between the last normal session and the runaway session helps isolate what changed. Platforms such as Ellipsis provide session-level observability by logging every token, tool call, and diff with the credential and budget context that triggered it.
Cost must also sit next to quality as a first-class metric. An agent that finishes its task at ruinous cost has still failed operationally, even if its output is correct. Structured traces also help with audits, as regulatory pressure and NIST's agent standards work make records of each request more necessary. Sandboxing alone does not provide the tool-call, guardrail-decision, and cost-attribution trail needed for that work.
How configuration-as-code prevents the defaults that cause most runaway sessions
Many runaway sessions begin with an unreviewed default, including a missing retry ceiling, a blank budget field, or a “Fast Mode” setting left enabled. Peter Steinberger's case attributed a significant share of $1.3 million in spending to a single “Fast Mode” configuration setting. Identifying that setting exposed an opportunity to reduce costs substantially, but the configuration had not been reviewed because it was not version-controlled. The failure was therefore also a missing review boundary.
Putting agent definitions in YAML, AGENTS.md, or other repository files means changes to behavior go through the same approval process as code. A budget ceiling in a pull request becomes a visible engineering change. Permission scope belongs at that boundary too. The configuration should deny write access to production databases for an agent tasked with reviewing code, so the model does not have to judge that limit for itself.
Microsoft Foundry's CI/CD reference architecture logs token usage for each query at CI without using it as a blocking gate. It alerts on meaningful regression at production promotion, bringing cost governance into the deployment workflow. NVIDIA's OpenShell, launched at GTC 2026, applies a related principle to security through declarative YAML policy with kernel-level enforcement.
For agents defined in repository YAML, Ellipsis combines isolated cloud sandboxes with credentials minted per session, scoped to granted repositories, and revoked at teardown. Its hard budget caps operate per session, per day, per week, and per month.
What a practical detection and response stack looks like end to end
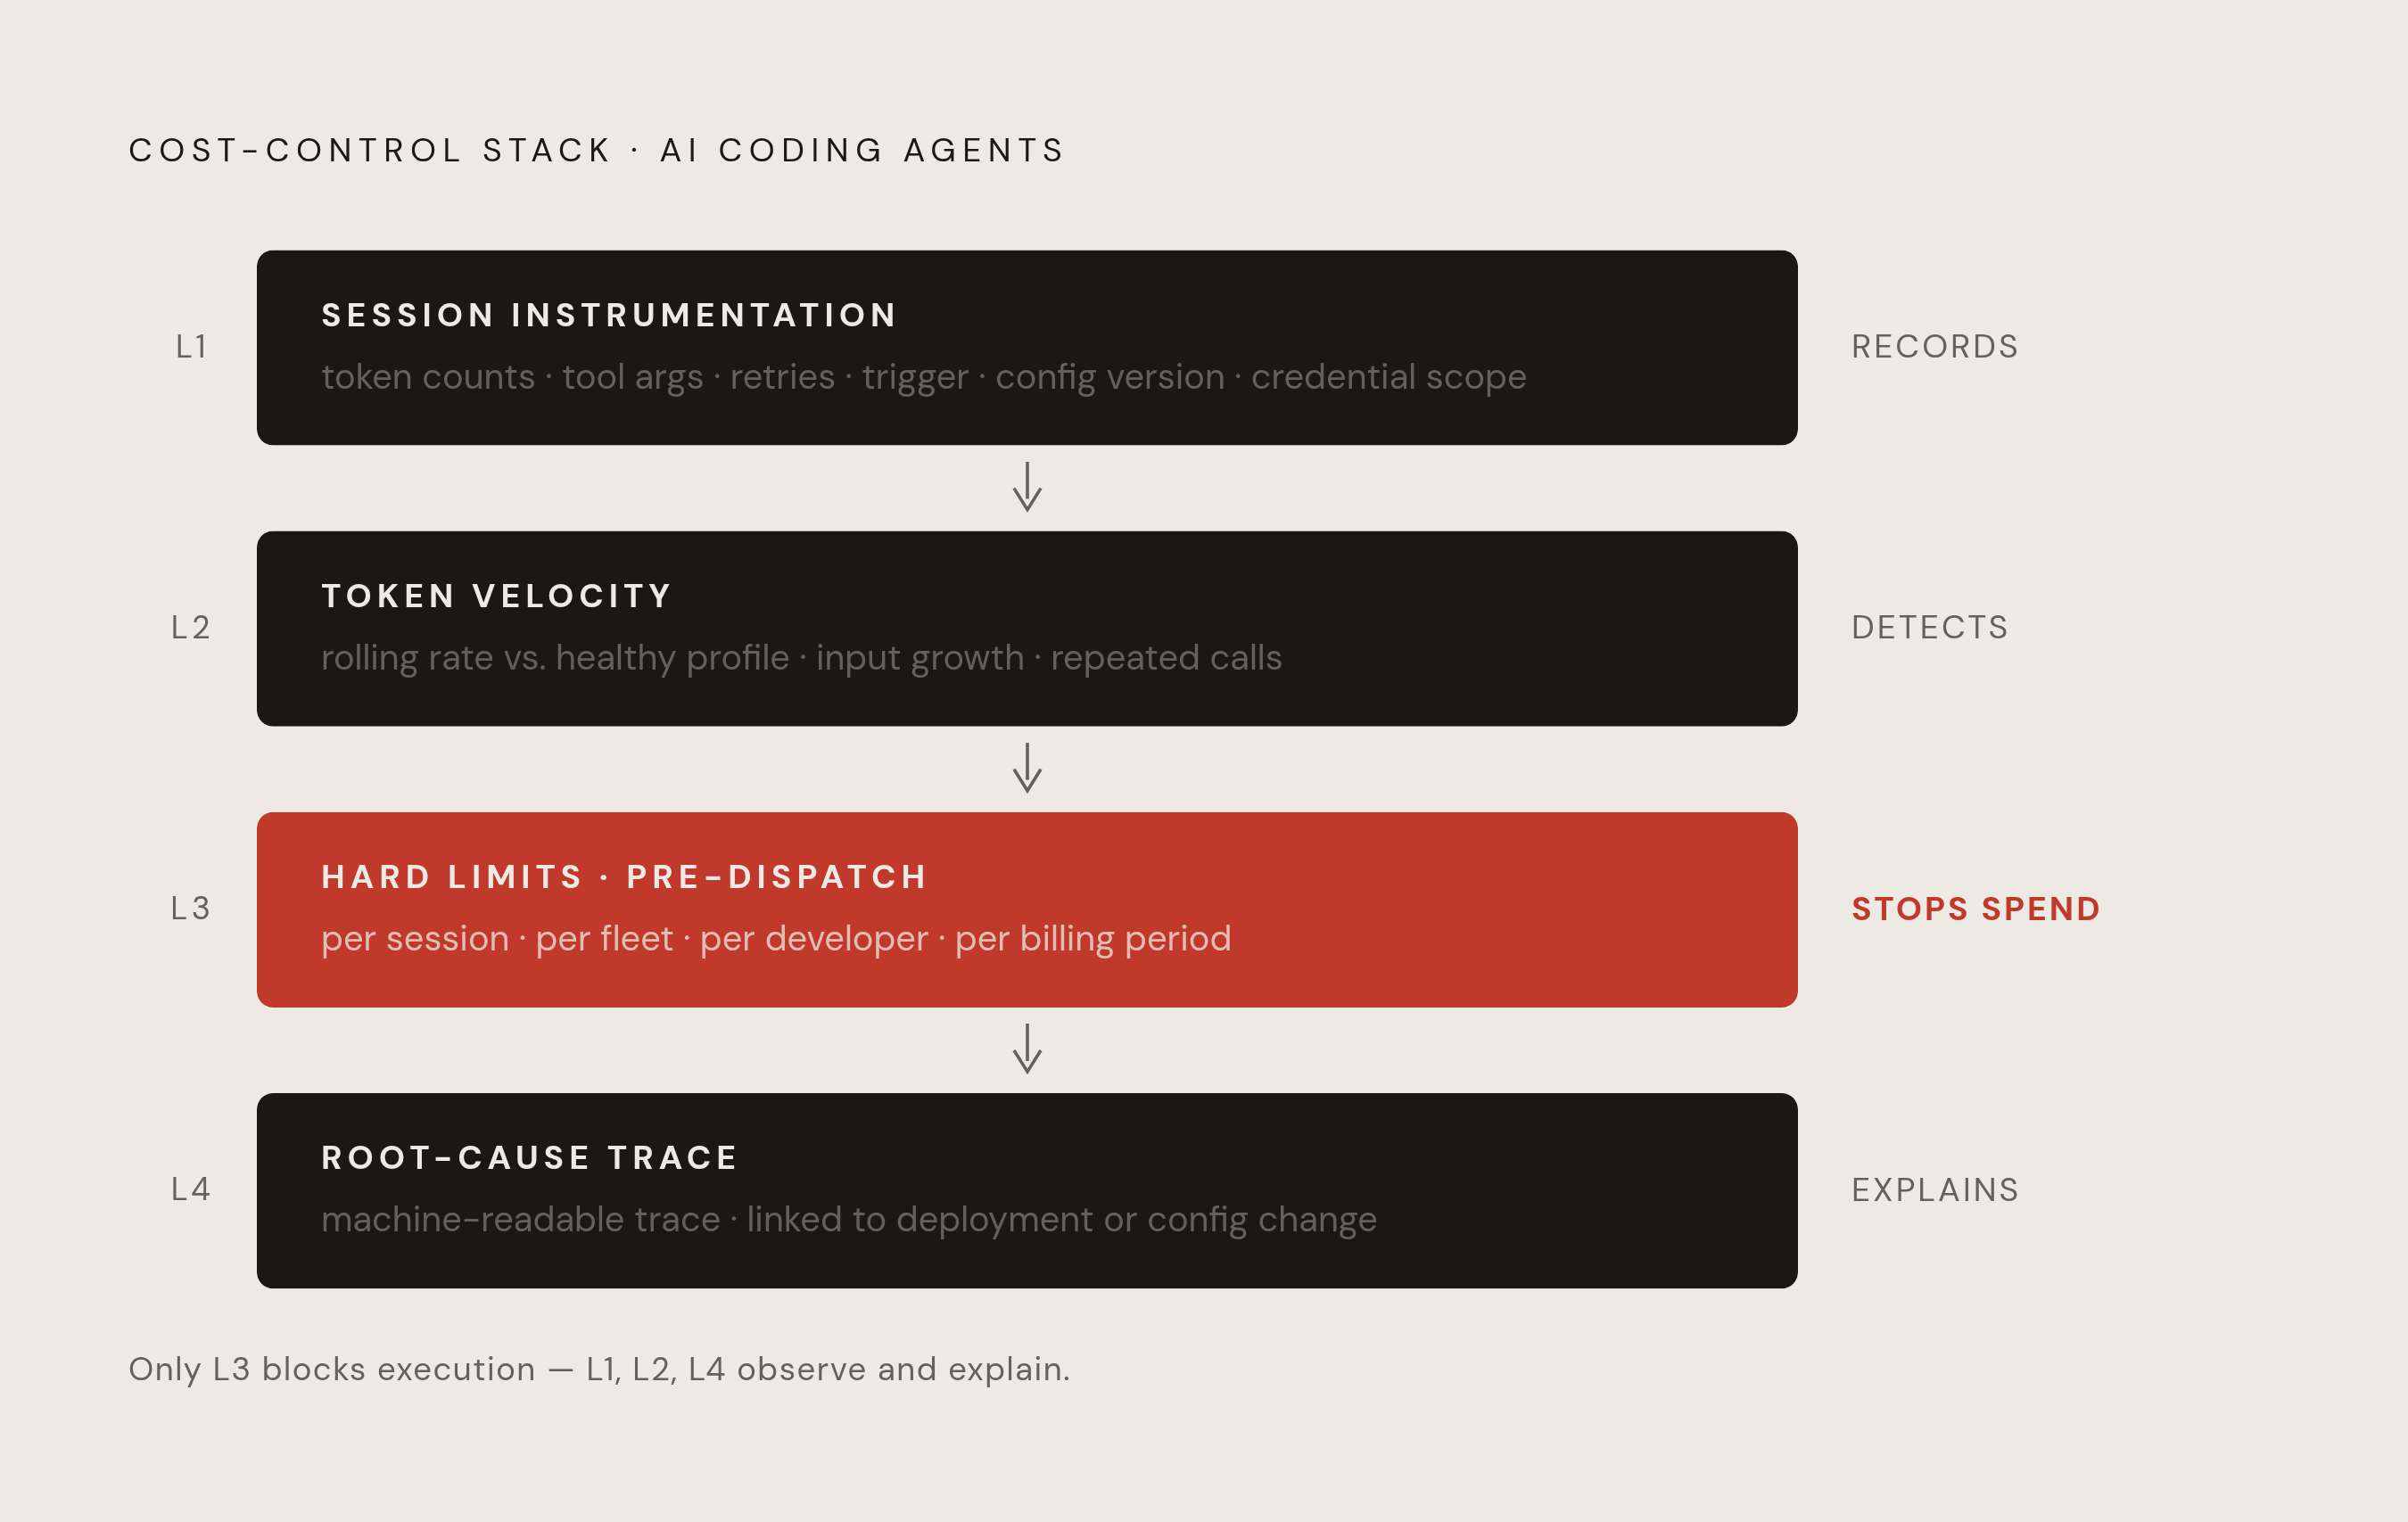
The practical stack has four integrated layers, beginning with session instrumentation. Input and output counts for each call show how much was used, while tool arguments, outputs, and retries show what the agent did. The session trigger, configuration version, and credential scope make both attributable. Without those records, the other layers cannot reliably tell a runaway execution from normal work.
The second layer computes rolling token velocity against the healthy profile of the task, reinforced by input growth and repeated calls. The third enforces hard limits before dispatch for sessions, agent fleets, developers, and billing periods. A session can violate either boundary without violating the other.
The fourth layer supports root-cause analysis by preserving a complete, machine-readable trace when execution is terminated and linking it to the preceding deployment or configuration change. All four layers meet at configuration-as-code. When instrumentation, thresholds, limits, and credential scope live in the repository, their changes become reviewable, versioned, and attributable before the agent starts spending.