Observability Tooling for LLM Tool Call Traces in Agent Sessions
Agent sessions fail silently because traditional monitoring only checks if each step succeeded.
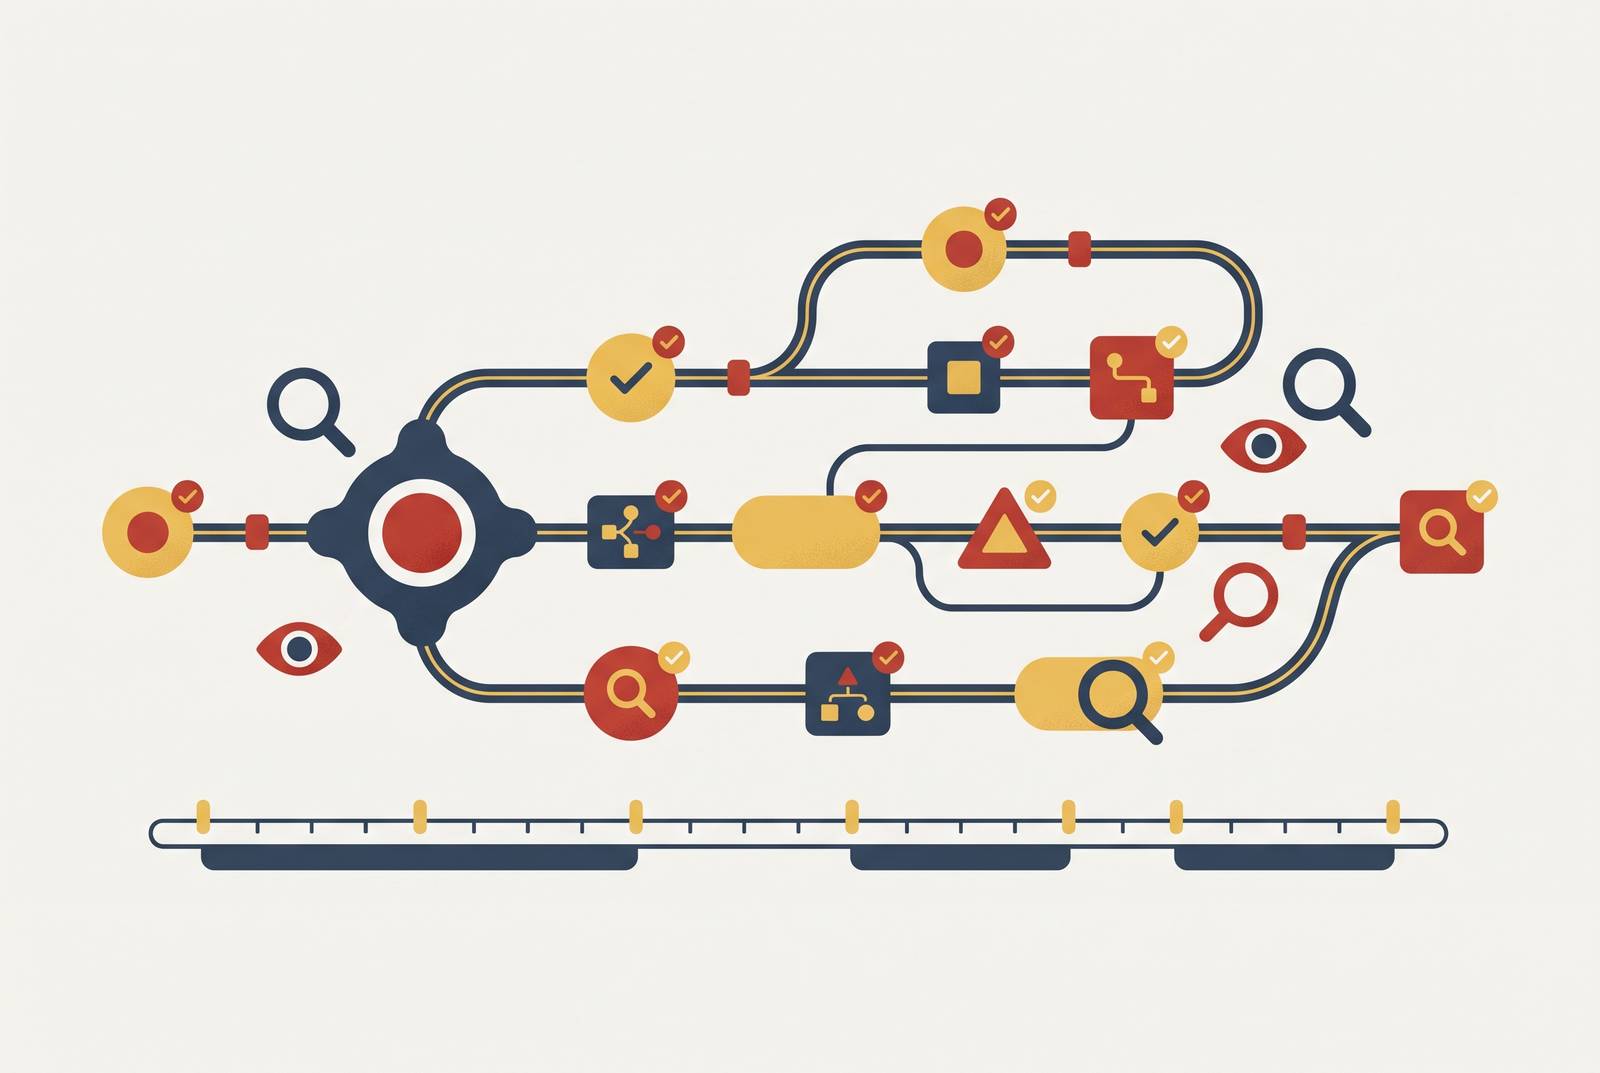
A dashboard can show every span green while an agent session is quietly failing the task it was given. The tooling built for stateless request-response systems was never designed to catch the failure modes that define agentic work, producing a gap between what the trace shows and what actually happened in the session that is already costing real money in production.
Consider what happened at Uber. Uber rolled out access to Claude Code to thousands of engineers in December 2025, and by February 2026 the share of engineers actively using it had nearly doubled. By April, Uber had burned through its entire 2026 AI budget. That outcome was only possible because per-session cost and trajectory behavior were not observable in real time, at a scale large enough to turn a blind spot into a budget event within four months.
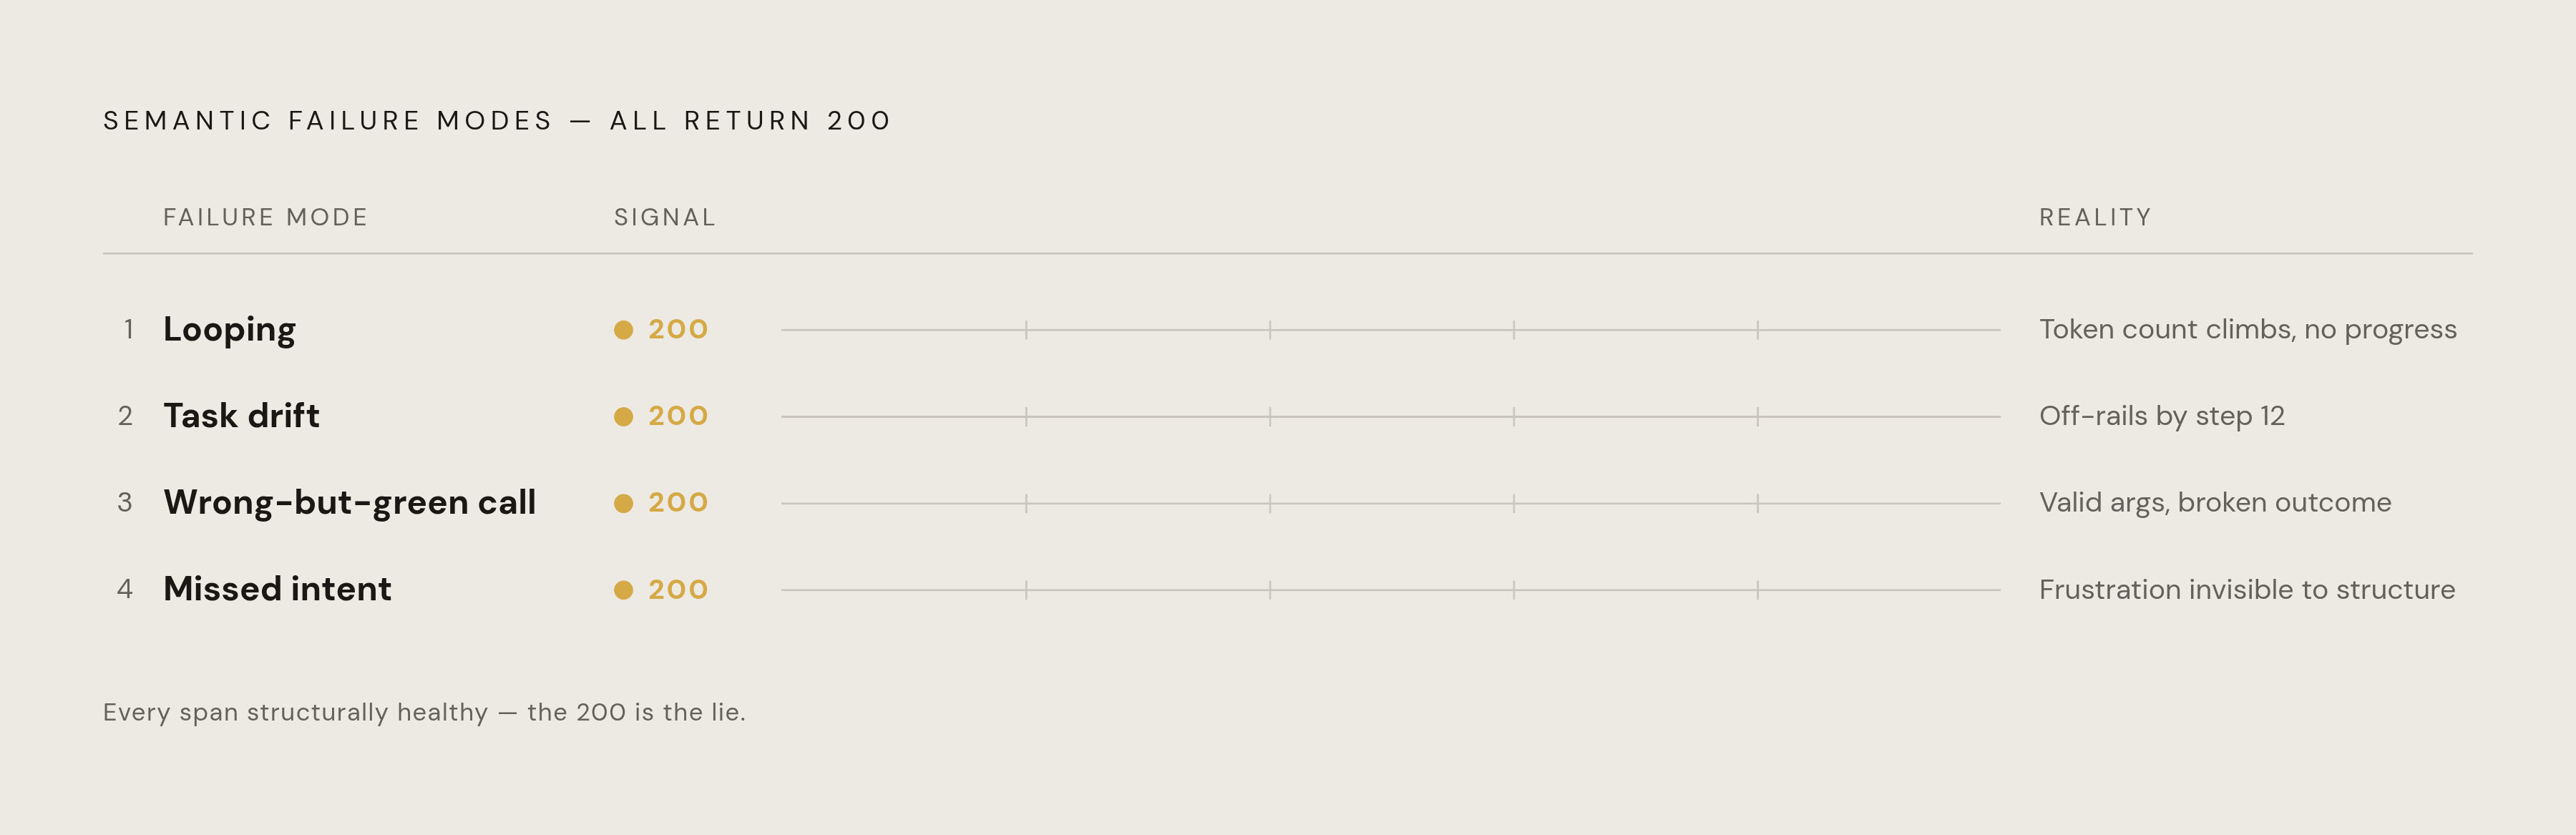
A traditional APM tool built for HTTP services treats a 200 response as success, full stop. An agent session can return 200 on every single span while the agent loops on the same tool call, drifts off the original task, or calls the correct tool with arguments that are subtly wrong, and the dashboard reads as healthy throughput the entire time. Morph's 2026 agent observability analysis states the mechanism: an agent failure often does not appear in the trace because the agent ran every step correctly at the mechanical level and still failed at the level of the task itself.
Four failure modes, each semantic rather than structural, illustrate why this keeps happening. An agent can loop, calling the same tool repeatedly with slightly varied arguments so the repetition never registers as an exact duplicate, while the token count climbs and the dashboard shows nothing but normal activity. An agent can drift off task, with no single step looking wrong in isolation even as the trajectory as a whole has left the rails by step 12. An agent can produce a wrong-but-green tool call, where the arguments are syntactically valid, the response is well-formed, and the outcome is still broken. And an agent can miss user frustration or fall for a prompt injection, failures that live entirely in the meaning of a turn and never touch its structure. None of these register as an error code. All four are invisible to a tool that only checks whether the call succeeded.
The agent trajectory as the unit of analysis
The concept that makes sense of all four failure modes is the trajectory: the full sequence of steps running from the original user request to the moment the agent declares itself finished. Observability built around the single LLM call cannot see a trajectory because a call and a trajectory are different kinds of object, not different sizes of the same one.
Morph's analysis draws this distinction cleanly. A single LLM call behaves like a function: a prompt goes in, a completion comes out, and the transaction is over. An agent is a loop. It plans, calls a tool, reads what the tool returns, decides whether to keep going, and eventually decides it's done. Each of those decisions is a place where the trajectory can go wrong, and none of them exists inside a single call's input-output pair.
That reframing changes what observability has to capture at nearly every level. So the trace shape moves from a single span to a nested tree of plans, tool calls, and subagents. So you have to move cost attribution from tokens counted per call to tokens counted per step, per tool, and per subagent. So the failure signal is no longer an error code or a bad completion; it is a loop, a wrong tool choice, an off-task drift, or a run that hits its step limit without finishing. And the visibility of failure itself flips: a bad call is usually visible right there in the LLM trace, while a bad trajectory is usually invisible in the agent trace, because every individual call inside it looked fine.
Braintrust's 2026 guide to agent observability frames the same shift in practical terms. Traditional APM captures request rate, latency, error rate, and span counts. Agent observability has to capture semantic behavior instead: which tool the agent picked, what arguments it passed, what came back, and how the next reasoning step changed in response to that result. A traditional dashboard can confirm the agent service is running. But it cannot confirm that the agent picked the right tool, passed the right arguments, pulled the right memory entry, or stayed on the plan it started with. Every section that follows in this piece builds from that gap.
The minimum viable trace schema for a trajectory, what every span must carry
Once the trajectory is the unit of analysis, you need to ask what a trace actually has to record at each step so trajectory-level failures become visible, not just call-level mechanics. Braintrust's guide identifies four typed span categories as the pillars of that schema: tool-call spans, reasoning spans, state transition spans, and memory operation spans. Each one is typed with timestamps and parent-child links, letting a single trace reconstruct the full execution graph behind one user request.
Tool-call spans need to carry the tool name, the arguments passed, the raw output returned, the duration, the retry count, and the error state. Without the retry count specifically, a looping agent's repeated tool calls are indistinguishable from legitimate parallel work, because both appear as multiple calls to the same tool with plausible-looking arguments.
Reasoning spans need to carry the model's plan, the action it picked, the observation it made from the result, and what it decided to do next. This is the span type that reveals plan drift and wrong-branch selection, failures that a single LLM span has no way to show, since a lone call has no concept of a plan it might be drifting away from.
State transition spans need to carry working memory before and after each step, including context edits and any handoff payloads passed between stages. This is what catches context loss and the kind of summarization drift that quietly degrades a session the longer it runs, well before any single step looks broken.
Memory operation spans need to carry the reads and writes made to long-term stores: the query issued, the entries returned, their relevance scores, and how fresh they are. This is what exposes stale reads, retrieval that pulls the wrong entity's data, and memory leakage between users, none of which an aggregate metric like average latency or error rate will ever surface.
Every span in the trajectory also needs four identifiers to make the whole trace reconstructable after the fact: a trace ID, a parent span ID, a session ID, and a user or tenant ID. These are what let an engineer take one failed session and walk the entire tree of decisions that produced it, rather than staring at a pile of disconnected log lines.
OpenTelemetry GenAI conventions and MCP spans
That schema would be a lot to build from scratch for every agent framework in use. A vendor-neutral standard for it already exists. OpenTelemetry's GenAI semantic conventions have become the wire format most agent telemetry is settling around, and the conventions standardize the model being called, the input and output token counts, and, when a team opts in, the full content of prompts, completions, tool calls, and tool results.
The part of the stack that long stayed a black box was the tool layer itself, and that changed with the addition of MCP spans in OpenTelemetry version 1.39. MCP semantic conventions introduce attributes including mcp.method.name, mcp.session.id, and mcp.protocol.versionand these spans enrich the existing execute_tool spans. An agent calling ten different MCP servers in the course of one session can now be traced with the same clarity as an agent calling a single local function, which matters a great deal for any team building on top of tool ecosystems beyond a handful of hand-written integrations.
Coding agent runtimes have started emitting this telemetry natively, without requiring custom instrumentation. Claude Code exports metrics and log events through OpenTelemetry as generally available signals, but its trace support is still in beta. OpenAI Codex exports structured log events and OTel metrics covering API requests, tool calls, and sessions. So if a team adopts either runtime, trajectory-level spans arrive out of the box.
Most gen_ai.* attributes in the OpenTelemetry GenAI conventions currently carry a Development stability status, not a finalized one, and fields can change shape or get renamed as the spec matures. If you adopt this standard, you should pin the schema version you build against and plan for migration work as the conventions stabilize, rather than treat the current attribute set as permanent.
Multi-agent handoffs and trajectory tracing
Single-agent tracing is already demanding, and multi-agent systems raise the stakes further: the handoff between agents is where trajectory coherence breaks down most often, and it's where tools that only trace individual LLM calls leave the largest gap in the record.
The failure pattern is mechanical and easy to reproduce. When a planning agent hands off work to a sub-agent, a tool that only traces LLM calls produces two separate traces: one that ends at the handoff and another that starts fresh at the sub-agent's first call. Nothing records what payload actually crossed between them. When the sub-agent later fails, there is no way to tell whether the failure originated in its own execution or in a handoff payload that was already corrupted before the sub-agent ever started.
The fix is parent-child span propagation, and it carries the same architectural principle the schema section set out into the multi-agent case. The handoff payload gets recorded as a span on the parent agent's trace. The receiving agent's entire run is nested underneath that handoff span. The same trace ID flows through both agents, so the resulting trace shows the planning agent's decisions, the exact handoff payload, the sub-agent's tool calls, and the final response in a single connected view.
This isn't a problem reserved for exotic architectures. Braintrust's guide points to production teams running mixes of OpenAI Agents SDK, LangGraph, Mastra, Pydantic AI, and custom in-house orchestrators, often several of these at once inside the same organization. If instrumentation works within just one framework's execution model, it produces an incomplete trace the moment a handoff crosses into a different framework, so you need multi-framework trace coherence at meaningful scale, not just when you run unusually complex pipelines.
Message-bus visibility compounds the issue further. Tools that trace LLM output alone miss race conditions and infinite loops that occur in the messaging layer connecting agents to each other. To diagnose a real agent communication failure in production, you need both LLM output tracing and visibility into the message bus itself, since the failure can originate in either layer and look identical from the outside.
Structural traces are necessary but insufficient, catching loops and drift needs a semantic layer
Everything described so far, the span schema, the OpenTelemetry wiring, the parent-child propagation across handoffs, produces a structurally complete trace. A correctly instrumented trajectory trace can capture every span with full fidelity and still fail to detect a loop, an off-task drift, or a run that completed an objective different from the one it was given. These failures are semantic rather than structural, and spans record the mechanics of what happened, not the meaning of what happened.
Morph's analysis states the consequence directly: every span in a looping run returns 200, the token total keeps climbing, and the dashboard reads as healthy throughput the whole time. No extra structural detail, no extra field on the tool-call span, no finer-grained timestamp, can change that outcome. Only a layer that classifies the meaning of each turn can see a loop actually forming as it happens.
That is the job of a semantic evaluation layer sitting on top of the structural trace. It scores each step for plan coherence, so it catches the moment the agent's stated next action starts to diverge from the goal it was given. It classifies the intent behind each turn, distinguishing a user's frustrated rephrasing of the same request from an actual new request. It evaluates whether a tool call's arguments were correct independent of whether the tool happened to return a non-error response. And it flags prompt-injection attempts that look, at the trace level, identical to any benign turn.
Braintrust's guide describes this evaluation layer as scoring production traces and feeding the failures it finds back into the eval suite, turning the observability system into a quality loop rather than a passive archive of what already happened. Teams that treat their trace viewer as the whole of their observability system will miss precisely the failure modes most likely to burn through budget, frustrate a user, or violate a policy, because none of those failures ever appear as a span. Structural tracing is a necessary foundation. It is not sufficient on its own.
Cost attribution as a first-class observability concern, not a billing afterthought
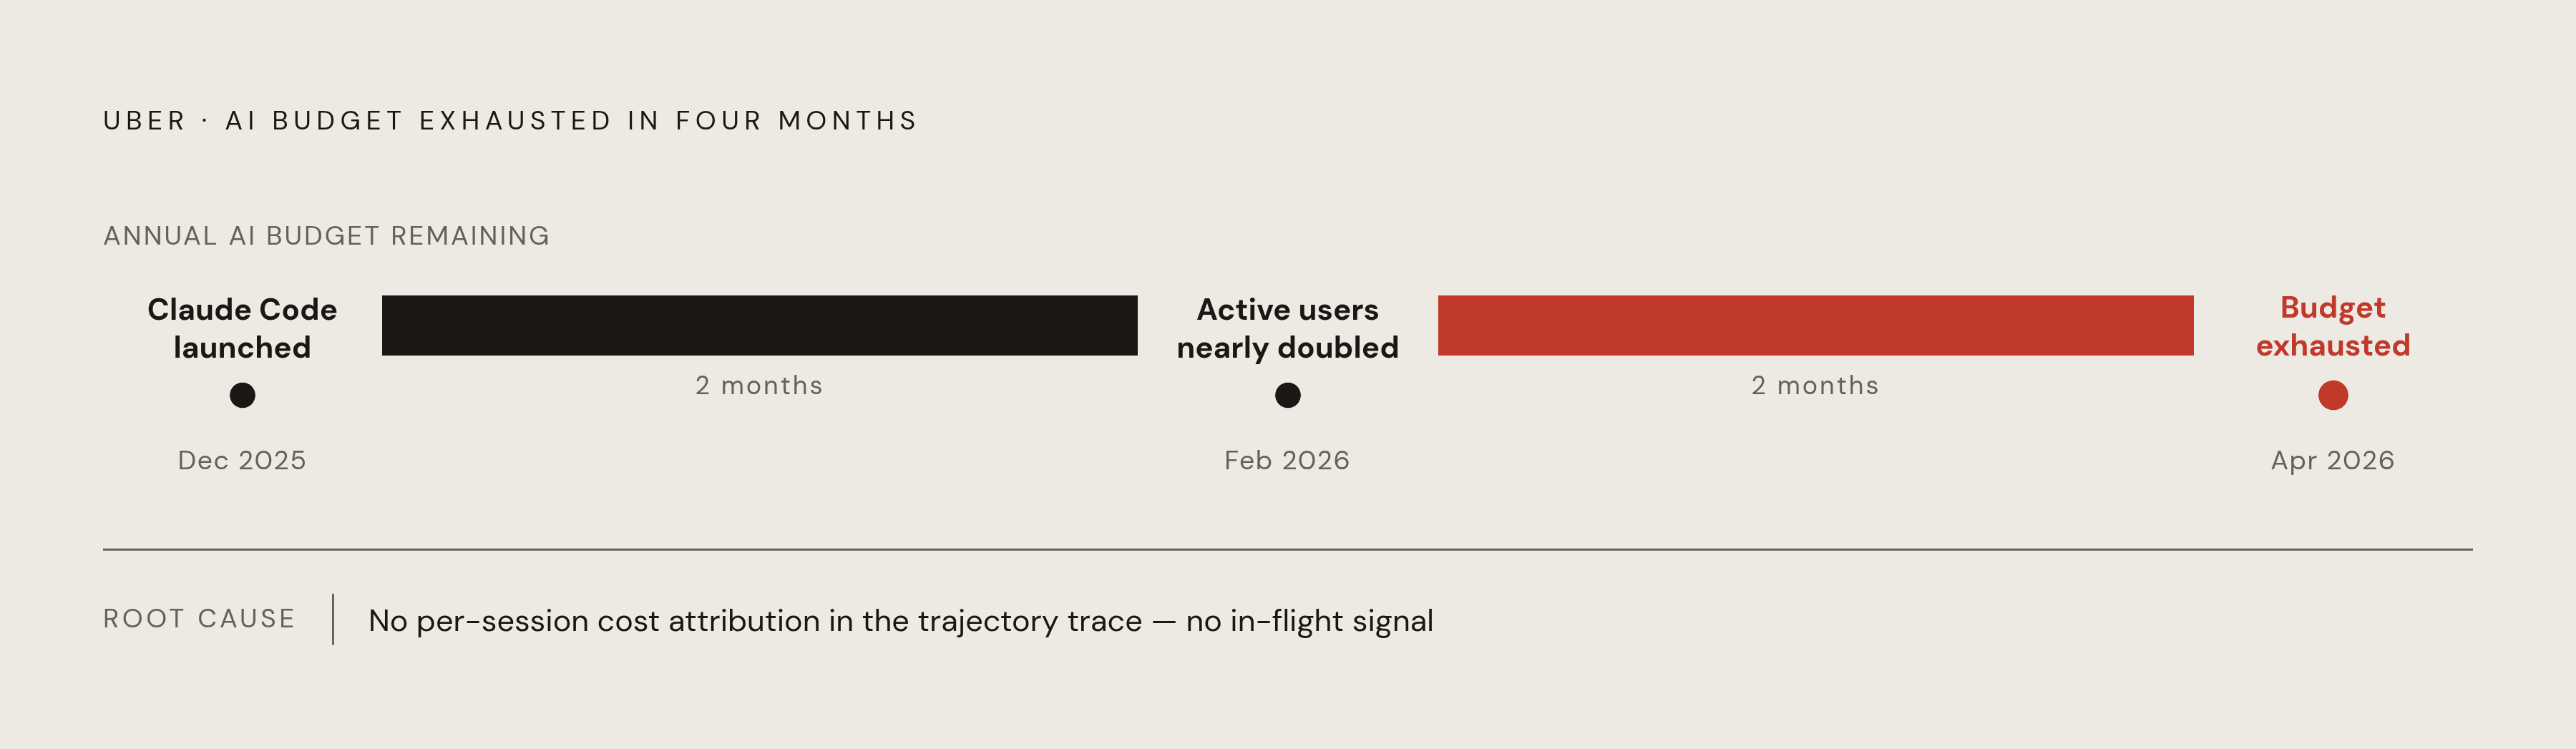
The financial version of this same gap is where the argument closes. Cost attribution has to be embedded at the span level inside the trajectory trace itself, tracked in real time rather than aggregated at the session level and reviewed after the month closes, because the failure modes that burn through budget are the same ones that look perfectly healthy in a structural trace.
Uber's experience is the clearest large-scale illustration of what happens without that wiring in place. If you don't build per-session, per-developer cost attribution into the trace, you have no way to detect that a fleet of agent sessions is on pace to exhaust a whole year's budget within months, and the only signal you get arrives once the budget is already gone.
If cost attribution is built into the span level, rather than bolted on as a billing report, you can detect in real time when a session's per-step token cost is climbing, which signals a loop forming before the loop ever completes. It enables budget enforcement set at the session, developer, and time-period level, with hard caps that interrupt a runaway session in the moment and report its cost before the fact. And it lets you attribute cost to specific tool calls and specific subagents, so you can see which tools or which agents run disproportionately expensive across a whole fleet of sessions, instead of finding out only once the aggregate bill arrives.